Results Analysis (Pile Analysis)#
Download the LatAxPileAnalysis.rspile2 for this example.
Code Snippet: Visualization of Pile Analysis Results#
from RSPileScripting.RSPileModeler import RSPileModeler
from RSPileScripting.enums import *
import os, inspect
import matplotlib.pyplot as plt

current_dir = os.path.dirname(os.path.abspath(inspect.getfile(lambda: None)))
RSPileModeler.startApplication(60044)

rspile_modeler = RSPileModeler(60044)
model = rspile_modeler.openFile(rf"{current_dir}\example_models\LatAxPileAnalysis.rspile2")

model.save()
model.compute()

results_tables = model.getPileResultsTables(GraphingOptions.DEPTH_FROM_PILE_HEAD, GraphingOptions.DISPLACEMENT_X, GraphingOptions.AX_LAT_DISPLACEMENT_Z)

pile_4_results = results_tables["Pile 4"]

#create a plot of the displacement (z) vs depth for Pile 4
depth_pile_4 = pile_4_results[pile_4_results.getColumnName(GraphingOptions.DEPTH_FROM_PILE_HEAD)]
displacement_pile_4 = pile_4_results[pile_4_results.getColumnName(GraphingOptions.AX_LAT_DISPLACEMENT_Z)]

plt.figure(figsize=(8, 6))
plt.plot(displacement_pile_4, depth_pile_4, marker='o', label='Pile 4')

# Customize the plot
plt.xlabel(pile_4_results.getColumnName(GraphingOptions.AX_LAT_DISPLACEMENT_Z))
plt.ylabel(pile_4_results.getColumnName(GraphingOptions.DEPTH_FROM_PILE_HEAD))
plt.gca().invert_yaxis()
plt.gca().invert_xaxis()
plt.title("Pile 4: Displacement vs Depth")
plt.grid(True)
plt.legend()
plt.tight_layout()

plt.savefig("pile_4_displacement_vs_depth.png", dpi=300)

plt.figure(figsize=(8, 6))
for pile_name, pile_results in results_tables.items():
	# Extract Depth and Lateral Displacement (X) for each pile
	depth_pile = pile_results[pile_results.getColumnName(GraphingOptions.DEPTH_FROM_PILE_HEAD)]
	displacement_pile = pile_results[pile_results.getColumnName(GraphingOptions.DISPLACEMENT_X)]
	plt.plot(displacement_pile, depth_pile, label=pile_name)

plt.xlabel("Lateral Displacement in X Direction (mm)")
plt.ylabel("Depth from Pile Head (m)")
plt.gca().invert_yaxis()
plt.title("Lateral Displacement vs Depth for All Piles")
plt.grid(True)
plt.legend()
plt.tight_layout()
plt.savefig("all_piles_displacement_vs_depth.png", dpi=300)

plt.close('all')
model.save()
model.close()

rspile_modeler.closeApplication()
Figures#
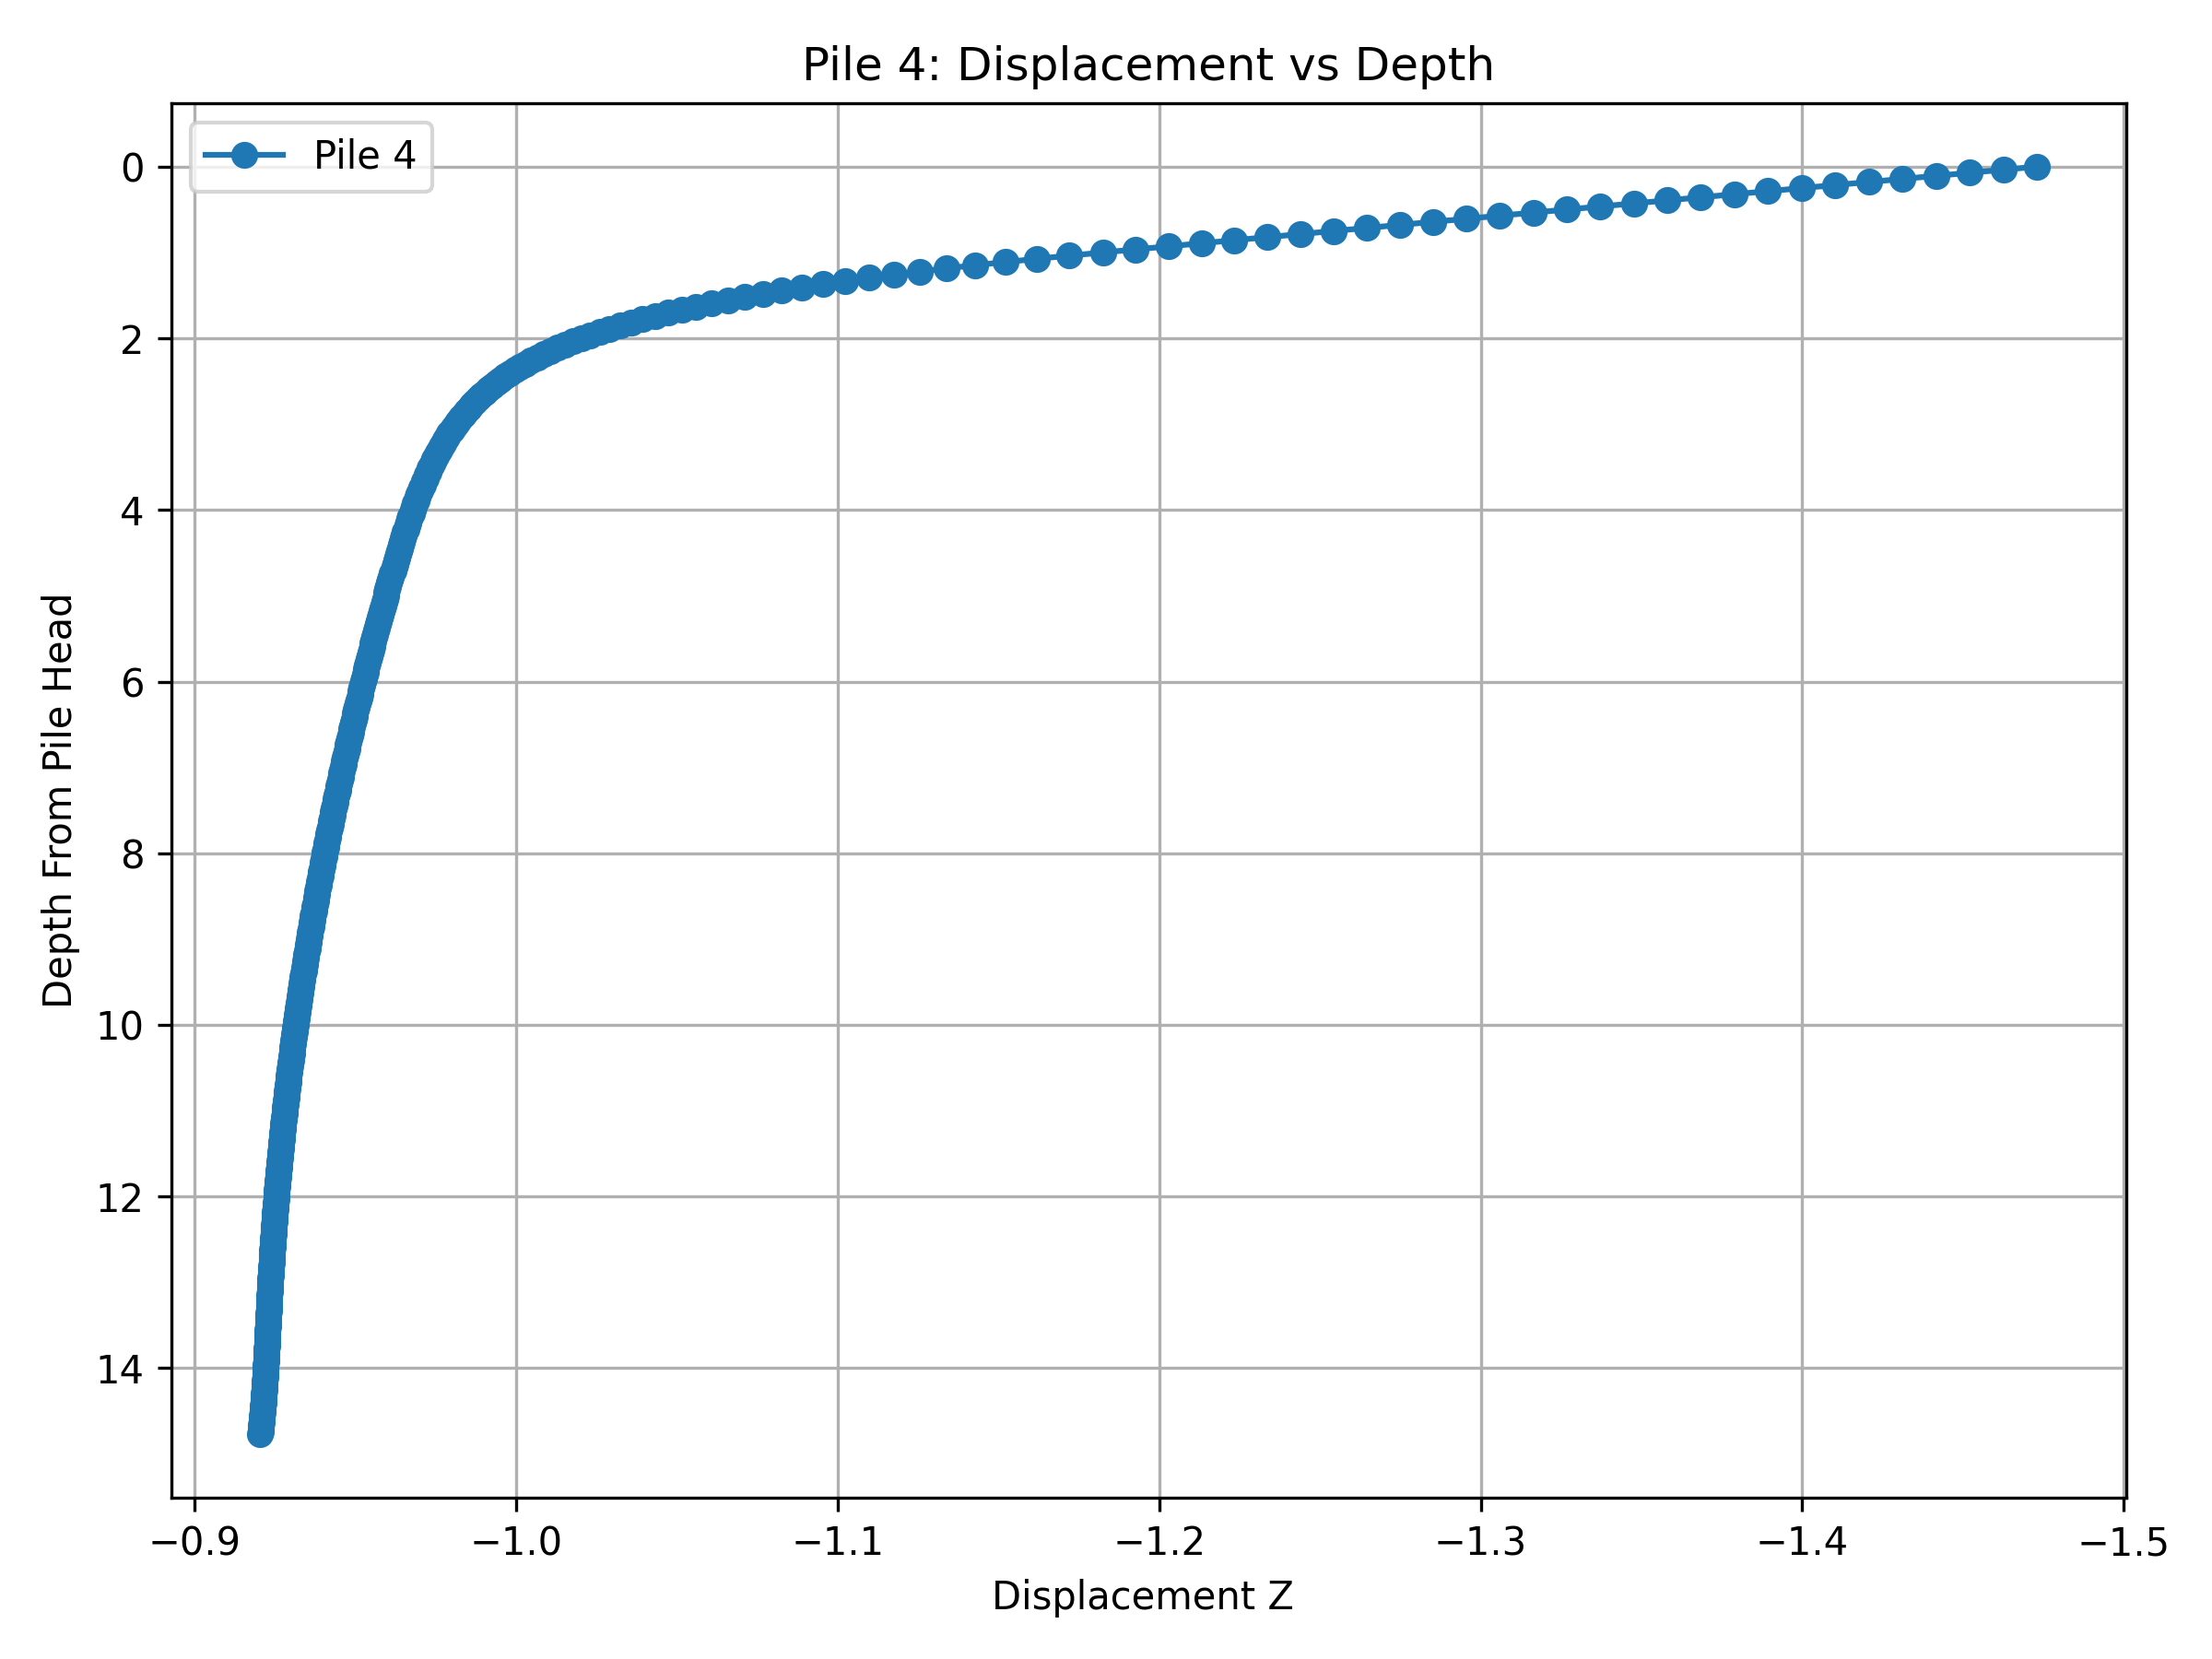
Displacement vs Depth for Pile 4.#
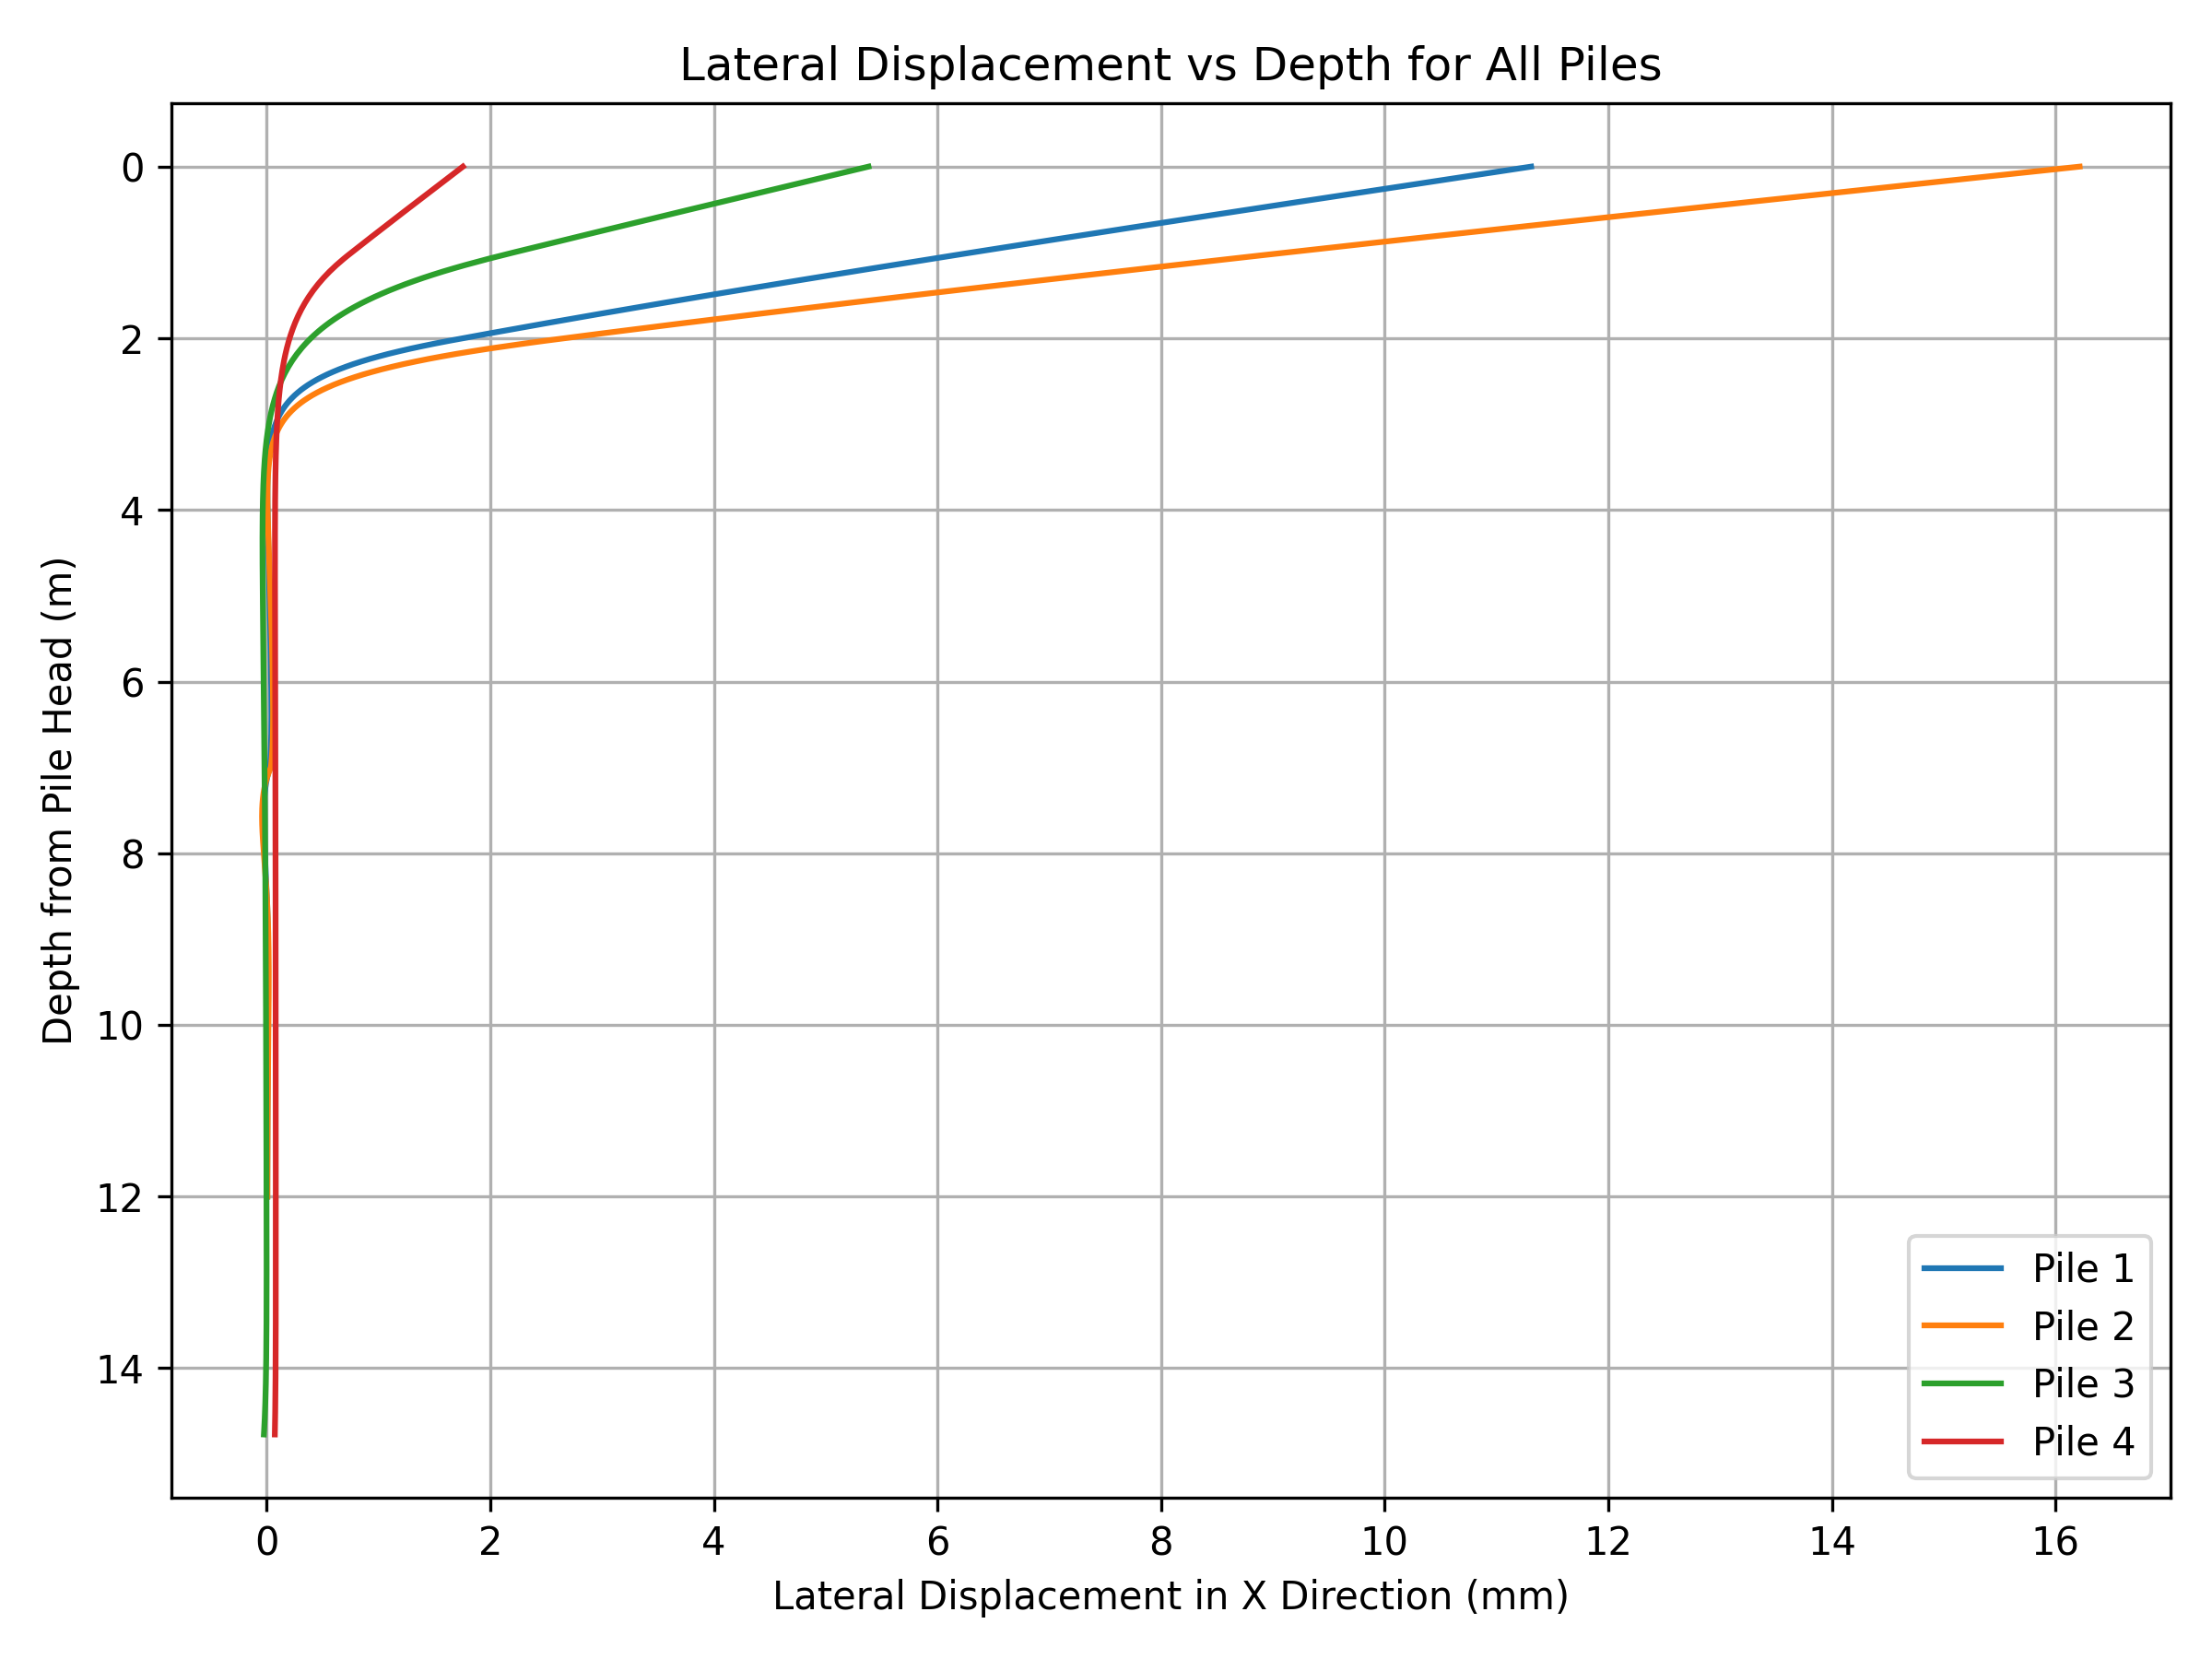
Displacement vs Depth for all piles.#